
Last Updated: November 12, 2026
Quick Summary
Map neutrality is a myth because every map is a model built from choices about purpose, scale, projection, selection, and labeling. Each choice simplifies reality, so no map shows the world without emphasis. Readers can judge any map by asking what it was built to show and what it leaves out.
- Every map is a model, and every model simplifies reality through deliberate choices.
- A projection can preserve shape, area, distance, or direction, but never all four at once.
- Place names and borders carry political weight, so an unacknowledged label is itself a claim.
- Digital maps assemble results through ranking, routing, and personalization, often invisibly.
- Compare a disputed label or route against a second, independent source before trusting it.
Table of Contents
- Why Map Neutrality Is a Modern Myth
- Are Maps Neutral? How Mapmakers Make Choices
- Map Projections and Distortion: What Every Map Gets Wrong
- The Politics of Place Names and Territorial Claims
- How Maps Shape Perception of Place and Identity
- Digital Maps, Algorithms and Whose Perspectives Are Missing
- A Practical Checklist for Reading Any Map Critically
- Frequently Asked Questions
Most people assume a map is a plain record of where things are, but every map is a set of decisions about what to show, what to leave out, and how to label it. The case for treating map neutrality as a modern myth is worth examining closely, because every map reflects a set of choices about what to include and how to present it. The good news is that you do not need a cartography degree to judge a map for yourself. This guide walks through the choices behind every map and gives you a repeatable way to test whether a given map is telling the whole story.
Why Map Neutrality Is a Modern Myth
The idea that a map can be neutral rests on the assumption that a map is a mirror. It is not. A map is a model, and every model simplifies. Someone decides the scale, the projection, which features get symbols, which names appear, and where the borders are drawn. Each of those choices is a judgment, even when it is made quietly and with good intentions. Treating the result as objective fact is where the myth begins.
Map neutrality is a useful goal for professional mapmakers, who work to reduce bias and state their sources. But neutrality as an absolute standard does not survive contact with the decisions involved. Naming the myth clearly helps readers stop asking "is this map true?" and start asking "what did this map choose to emphasize?"
Are Maps Neutral? How Mapmakers Make Choices
A mapmaker starts with a question: what is this map for? A road map for drivers, a voting district map, and a historical atlas answer different questions, so they include different information. Once the purpose is set, the mapmaker decides on a scale, which determines how much detail fits. Then comes selection: which roads, rivers, cities, and borders make the cut.
Each step narrows reality. A coastline drawn at one scale looks very different from the same coastline at another, and small islands may disappear entirely. Mapmakers rely on generalization, the process of simplifying shapes and removing detail, and generalization always involves judgment about what matters. The result is a useful tool, but it is a selected version of the world.
Map Projections and Distortion: What Every Map Gets Wrong
Projections are the clearest proof that no map is neutral, but the usual explanation stops at one fact: the Mercator projection makes Greenland look about the size of Africa when Africa is roughly fourteen times larger. That fact is true and worth knowing, yet it hides the actual mechanism. A projection is a set of mathematical rules for transferring points from a curved surface onto a flat one, and those rules cannot preserve everything at once.
Cartographers describe the trade-off in four properties. Shape (also called conformality) means small features keep their correct angles and outlines. Area (equivalence) means regions keep their correct relative size. Distance means distances from one or two points stay true. Direction means compass bearings stay straight. No projection preserves all four. The Mercator, for example, is conformal and keeps rhumb lines straight, which is why it dominated navigation for centuries, but it inflates area dramatically toward the poles. The equal-area projections used in many atlases, such as the Mollweide or the Eckert series, preserve relative size but distort shape, especially near the edges of the map. Compromise projections, including the Robinson and the Winkel Tripel, deliberately split the difference and preserve none of the four perfectly.
The practical consequence is that the projection you see is a statement about what the mapmaker thought mattered. A world map built for navigation will favor direction and shape. A world map built for comparing land areas, populations, or resources will favor area. A world map built for a classroom will often favor a compromise that looks balanced rather than one that is mathematically pure.
Watch out: a projection can be technically accurate and still mislead. A map that preserves area perfectly can make high-latitude countries look stretched and strange, and readers often mistake unfamiliar shape for error. The distortion is real, but it is a trade-off, not a mistake.
A second layer is orientation and centering. Most world maps place the prime meridian near the center, which pushes the Pacific Ocean to the edges and splits it in two. A map centered on the Pacific instead rearranges which continents appear at the margins and which sit at the visual center. Neither choice is neutral; each reflects a convention about whose part of the world is treated as the reference point.
The four properties a projection can preserve, and what each one sacrifices, are summarised below.
| Property | What it keeps correct | What it sacrifices |
|---|---|---|
| Shape (conformal) | Small features keep correct angles and outlines | Area, especially near the poles |
| Area (equivalent) | Regions keep correct relative size | Shape, especially near the edges |
| Distance | Distances from one or two points stay true | Most other properties |
| Direction | Compass bearings stay straight | Area and shape at scale |
| Mercator | Shape and straight rhumb lines | Area, inflating regions toward the poles |
| Robinson / Winkel Tripel | Compromise balance | Preserves none of the four perfectly |
The Politics of Place Names and Territorial Claims
Place names are among the most politically loaded features on any map. A name can record a language, a colonial history, a treaty, or a claim to land. When a government or institution changes a name, or chooses between competing names, the map becomes part of that dispute. Borders carry the same weight. Where a line is drawn, whether it is shown solid or dashed, and whether it is labeled "disputed" all express a position.
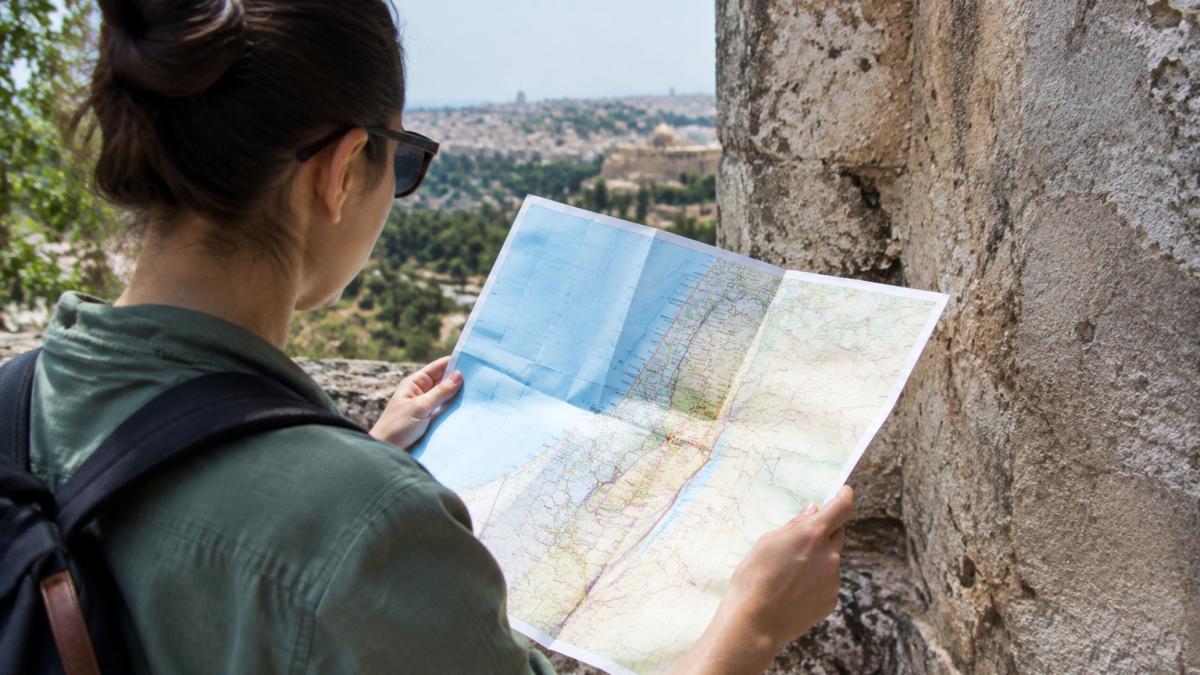
Examining these details tells you a lot. A map that shows one name without acknowledging alternatives is making a claim, whether or not it says so. Recognizing that is the first step toward reading a map critically rather than accepting it at face value.
How Maps Shape Perception of Place and Identity
Repeated exposure to a particular map can shape how people picture a region. Textbook maps that place a country at the center, or that show certain continents as larger, can teach viewers a sense of scale and importance that persists long after the map is forgotten. Over time, these images feed into identity, both for the people shown prominently and for those shown at the margins or left off entirely.
Maps also influence how people relate to places they have never visited. A child who grows up seeing their homeland labeled with a name that is not used locally, or not seeing it labeled at all, absorbs that message. The effect is subtle, which is why it is worth looking for deliberately.
Digital Maps, Algorithms and Whose Perspectives Are Missing
Printed maps freeze a set of choices at the moment of printing. Digital maps make those choices continuously, and often invisibly. This is the gap most articles about map bias leave open: they treat bias as a property of the printed sheet and stop there.
Start with search and ranking. When you type a category into a mapping app, the results are ordered by an algorithm that weighs factors such as relevance, prominence, distance, and user engagement.
Routing adds a second layer. Navigation algorithms optimize for travel time, distance, or a blend of both, and they may weight road class, turn cost, and live traffic differently.
Personalization is the third layer. Location, language settings, account history, and device type can change what a map shows. A viewer searching in one language may see a different set of labels than a viewer searching in another.
That unevenness is also where accessibility and representation gaps concentrate. Many digital maps are optimized for high-bandwidth connections and well-surveyed urban areas, which leaves rural communities, informal settlements, and Indigenous place names underrepresented or missing.
Watch out: a digital map that updates in real time can feel more authoritative than a printed one, but recency is not the same as accuracy. A freshly updated layer built on thin data can be more misleading than an older map built on careful survey work.
The useful habit is to treat every digital map as a draft assembled for a purpose you did not choose. Compare a route across two apps, check a disputed label against a second source, and look for the places the map does not show.
A Practical Checklist for Reading Any Map Critically
Use this checklist whenever you encounter a map you want to evaluate:
- Purpose: What question was this map built to answer, and who is its intended audience?
- Projection: Which property does it preserve (shape, area, distance, or direction), and what does it distort?
- Scale and generalization: What detail has been removed to fit the scale?
- Selection: Which places, features, or groups are included, and which are missing?
- Visual hierarchy: Which places are given the most visual weight, and does that match the purpose?
- Names and borders: Are names, borders, or disputed areas labeled, and are alternatives acknowledged?
- Sources and date: Who made the map, what data did they use, and how current is it?
- Corroboration: Can you check key claims against a second, differently made map or an independent source?
Working through these questions will not make any map perfectly neutral, but it will show you what the map is choosing to say. That is the real skill of map literacy, and it is one you can apply every time you pick up a map, open a navigation app, or read a headline about a border. If you want to see how this thinking applies to the places and names you live with, explore our Corrected Names Tee, which prints a short remedial geography lesson on the back of a shirt, or browse the Gulf of Mexico - Since 1552 Tee for another take on how place names carry history.
Frequently Asked Questions
What is one major flaw of the Mercator map?
The Mercator projection preserves angles so navigators could plot straight compass courses, but it does so by stretching areas far from the equator. Greenland appears roughly the size of Africa on many Mercator maps, although Africa is about 14 times larger. The flaw is not a mistake in arithmetic but a deliberate tradeoff: the projection serves navigation well and size comparison poorly. Anyone using a Mercator world map to compare countries should check which projection it uses and keep that tradeoff in mind.
Why are maps never completely accurate?
A map is a model of a three-dimensional, curved surface drawn on a flat page, and any flattening distorts some property such as shape, area, distance or direction. Mapmakers must also decide which features to include, how to simplify them and what scale to use. Each of these decisions removes information. A map can be accurate for a purpose, such as walking directions, while being inaccurate for another, such as comparing national sizes. The useful question is not whether a map is accurate but accurate for what.
How can place names on maps reflect political power?
Place names record who had the authority to name and recognize a feature. Names change after conquests, independence movements, treaties and renaming decisions by governments, and mapmakers choose which version to print. When a government or publisher adopts one name, the map signals an official position on the disputed place. Readers can check how a map handles a contested name by comparing it with the names used by the governments involved and by historical sources.
Can a map be objective?
A map can be careful, transparent and fit for a stated purpose, but it cannot be fully objective because every map involves choices about projection, selection, scale and labeling. Those choices reflect the mapmaker's purpose and audience. Good cartography makes its choices visible, citing its data sources, projection and intended use. Readers who ask what a map includes, what it leaves out and why it was designed that way are evaluating its reliability more effectively than by asking whether it is objective.
